Failure evidence
When a test fails, everything Piwi captured about that attempt lands on one screen. This page describes that screen — what each block holds, where the data came from, and how much more you get once a trace is attached.
Two different pages are involved, and Core concepts draws the line between them:
| Page | Path | Answers |
|---|---|---|
| Execution | /test-run-cases/:id | "why did this attempt fail?" — the diagnosis view |
| Test case | /test-cases/:id | "how has this test behaved over time?" — its history |
Most links from a run land on an execution; the test's title links to the test case above it.
One execution, diagnosis-first
Everything about a single test execution, laid out diagnosis-first. A pinned summary carries the status, title, copyable location, duration, worker, retries and duration-vs-average, plus at-a-glance signal badges (new regression, new flaky, passed-on-retry), any test annotations (@fixme, @slow, …), the wasted time spent in fixed waits, and metadata cards (environment, CI, branch, commit, author, browser, storage). Traces stream in live while the parent run is still running.
The tabs adapt to the result.
A failing execution opens on the Diagnosis tab — the whole investigation on one screen, modeled on the failure cluster page you already know. It leads with the raw error (copyable), then splits into a right-hand rail and a left-hand evidence funnel:
- Verdict — is this a new regression or flaky, how many times it retried, and how long the test has been failing, with a clickable recent-runs strip to jump between executions.
- Failure cluster (when the failure is clustered) — signature, error type, how many tests it hit, the cluster's own AI verdict, and a hand-off to the full cross-test investigation.
- AI diagnosis — diagnose this execution with one click, or Copy AI context to paste the full evidence bundle into your own assistant (works even with no provider configured). Cited evidence links jump to the matching section on the page.
- Evidence funnel — the test source as a call stack (the line that actually threw plus the callers above it, so a failure inside a helper is visible, not just the test line that invoked it — and, with a trace, the complete stack with real source), grouped failure evidence (screenshots, video, traces, attachments), alternative locators for a broken locator, an environment diff and visual diff against the last green run, console output, network requests with inline backend logs and a Full trace network view, app state, the failure-time ARIA snapshot, and the reconstructed DOM snapshot.
A passing execution opens on Steps, with an Artifacts tab for its traces, attachments, console and network.
Both keep a Performance tab (performance hints plus color-coded Web Vitals) and a History tab (this test's status and duration trend over recent runs, linking through to the full test history). A Copy retry command button in the header gives you the exact Playwright command to re-run just this test. The Web Vitals, network, console, ARIA-snapshot and alternative-locator data all come from the capture fixtures.
Trace-powered deep views
When an execution has an uploaded trace, two evidence blocks go deeper — no configuration beyond recording traces (trace: 'retain-on-failure' or 'on-first-retry' in your Playwright config):
- Test source → Full stack — the complete call stack of the failing action from the trace's stacks index, every frame with its real source read from the trace's embedded files (recorded by default with the Playwright test runner), the failing line highlighted, dependency frames folded, and Open-in-IDE links on each in-project frame. A toggle switches back to the reporter-captured frames.
- Network → Full trace — every request the page made (documents, scripts, images — not just fetch/XHR), on a waterfall with the failing action's time window shaded. Click a request for timing phases, request/response headers, and a capped body preview (JSON pretty-printed, images inline). Sensitive header values (
Authorization,Cookie, …) are masked server-side and never leave the dashboard, and token-shaped strings in URLs and bodies are masked too.
Executions without a trace keep the reporter-captured baseline — the blocks simply hint at what a trace would add. Traces recorded without embedded sources still show the full frame list.
Trace viewer
Every trace shows a View trace button that opens the full Playwright trace viewer — the same UI as npx playwright show-trace, with the DOM snapshot timeline, action log, network, console, and source.
The viewer is served by the dashboard itself (the playwright-core viewer assets are bundled and served at /trace-viewer/), so traces are never uploaded to a third party — unlike sending a colleague to trace.playwright.dev, the bytes stay on your server. Traces are stored efficiently: each archive is split into a slim events ZIP plus a project-wide, hash-deduplicated resource pool, and reconstructed on download (see Storage). Trace blobs are content-addressed, so the browser caches them and re-opening a trace is instant.
Authentication caveat
The bundled /trace-viewer/ is same-origin, so it works whether or not authentication is enabled. The hosted trace.playwright.dev viewer is a different origin and cannot send your session cookie, so it only works against a dashboard with auth disabled — use the built-in View trace button, which always works.
The test case page
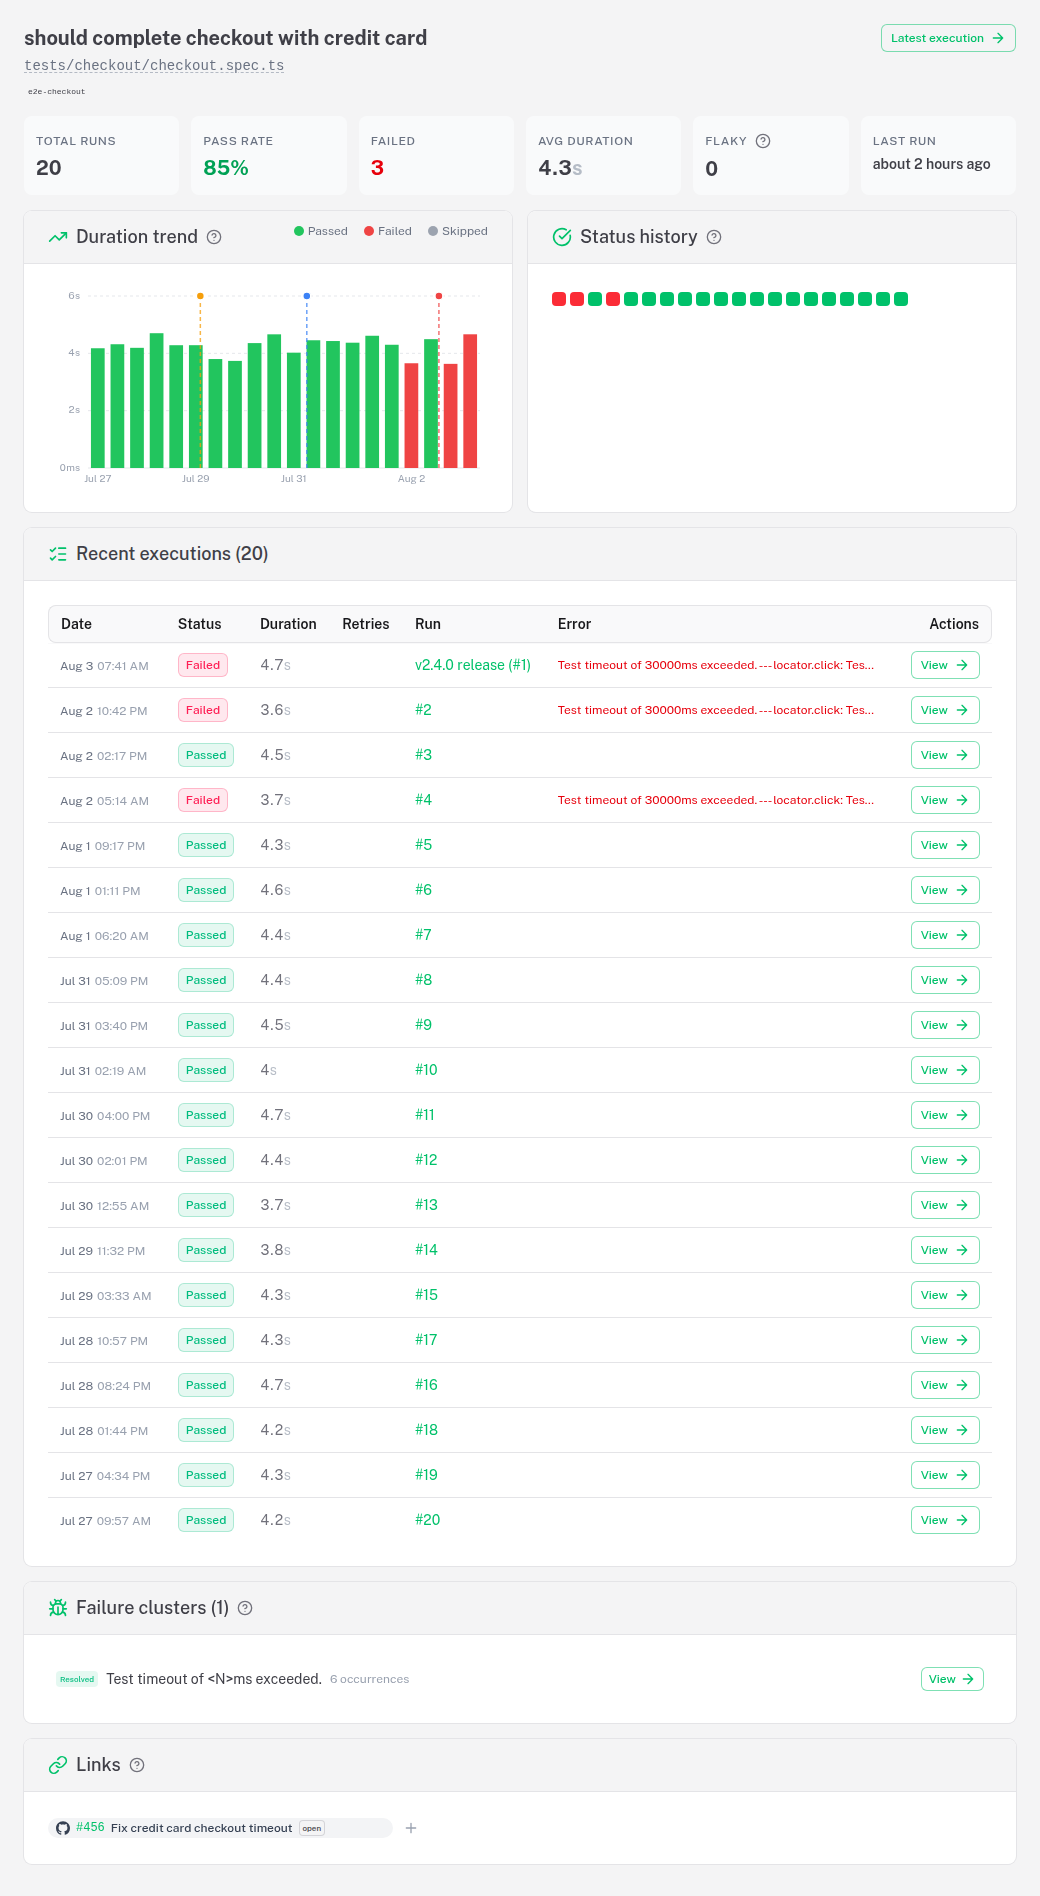
/test-cases/:id is the other axis: not one attempt, but the test's whole life. Total runs, pass rate, average duration and last run across every execution, a duration trend, a status-history strip, and the list of recent executions — each linking back to the diagnosis view above.
Taking it out of the dashboard
Any of this can leave the dashboard as a self-contained file — for a ticket attachment, a colleague without an account, or an archive that outlives your retention window. See Offline export.
See also
- Capture fixtures — the one file that produces the network, console, Web Vitals and locator evidence
- AI diagnosis & clustering — the same investigation across every test sharing a fingerprint
- Core concepts — execution versus test case
- Fix a broken locator — this page, used for one concrete job