Our suite takes too long — where is the time actually going?
The instinct is to look for slow tests. That is usually the smallest part of the bill. A suite's wall clock is mostly made of four things, and only one of them is "the app is slow":
- Waits somebody wrote —
waitForTimeoutsleeps that were a workaround once. - Timeouts nobody revisited — a 30s budget on a test that takes 3s costs 27s every time it fails.
- Retries of flaky tests — paid on every run, and they buy no signal.
- The application itself — the only part that needs a real fix.
Piwi measures all four separately, so you can spend effort where the minutes are. It does not make your app faster; it tells you whether that is even the problem.
1. Split the bill before optimizing anything
Analytics has two widgets that belong side by side: CI time (total minutes your runs consumed) and Wasted CI time — the portion that produced no signal, defined as time inside wait steps plus time spent on attempts that ended failed or timed out.
If wasted time is a small slice, your suite is honestly just big, and steps 2–4 will disappoint you — the application itself and more parallelism (steps 5 and 6) are where to look. If it is a large slice, the next three steps are where your afternoon goes.
The widget also states how much is reclaimable by tightening timeouts and dropping stale test.slow() marks, which is the one number worth quoting to whoever asks why CI is expensive.
2. Reclaim the waits you wrote
Piwi classifies wait steps as wasted time and totals them per execution and per run. By default only explicit sleeps count — waitForTimeout and friends — because framework-injected waits (load-state, wait-for-function) are usually unavoidable and would drown the signal.
- A failing execution's summary shows the wasted time spent in fixed waits, right next to its duration.
- A run's Timeline tab draws a per-worker timeline with a span-type filter — setup, actual test, wasted waits, teardown. Filter to wasted waits and the sleeps light up as bars you can click straight through to the test.
- Tune what counts in Settings → Performance (or lock it with
PIWI_WASTED_WAIT_PATTERNS). Classification happens when a run is viewed, so widening the patterns re-classifies your whole history immediately — no re-run needed.
Set the patterns to * once, look at the damage, then set them back. It is a fast way to see how much of the suite is waiting on something.
3. Tighten the timeouts that only bill you on failure
An oversized per-test timeout is free while tests pass and brutal when they don't: a hung test burns its entire budget before anyone learns anything.
The Performance tab's Timeout opportunities lists tests whose configured timeout dwarfs their real p95 duration, plus tests still carrying a test.slow() mark they have outgrown. Each row suggests a tighter value and the time reclaimable per failing run, ranked by impact.
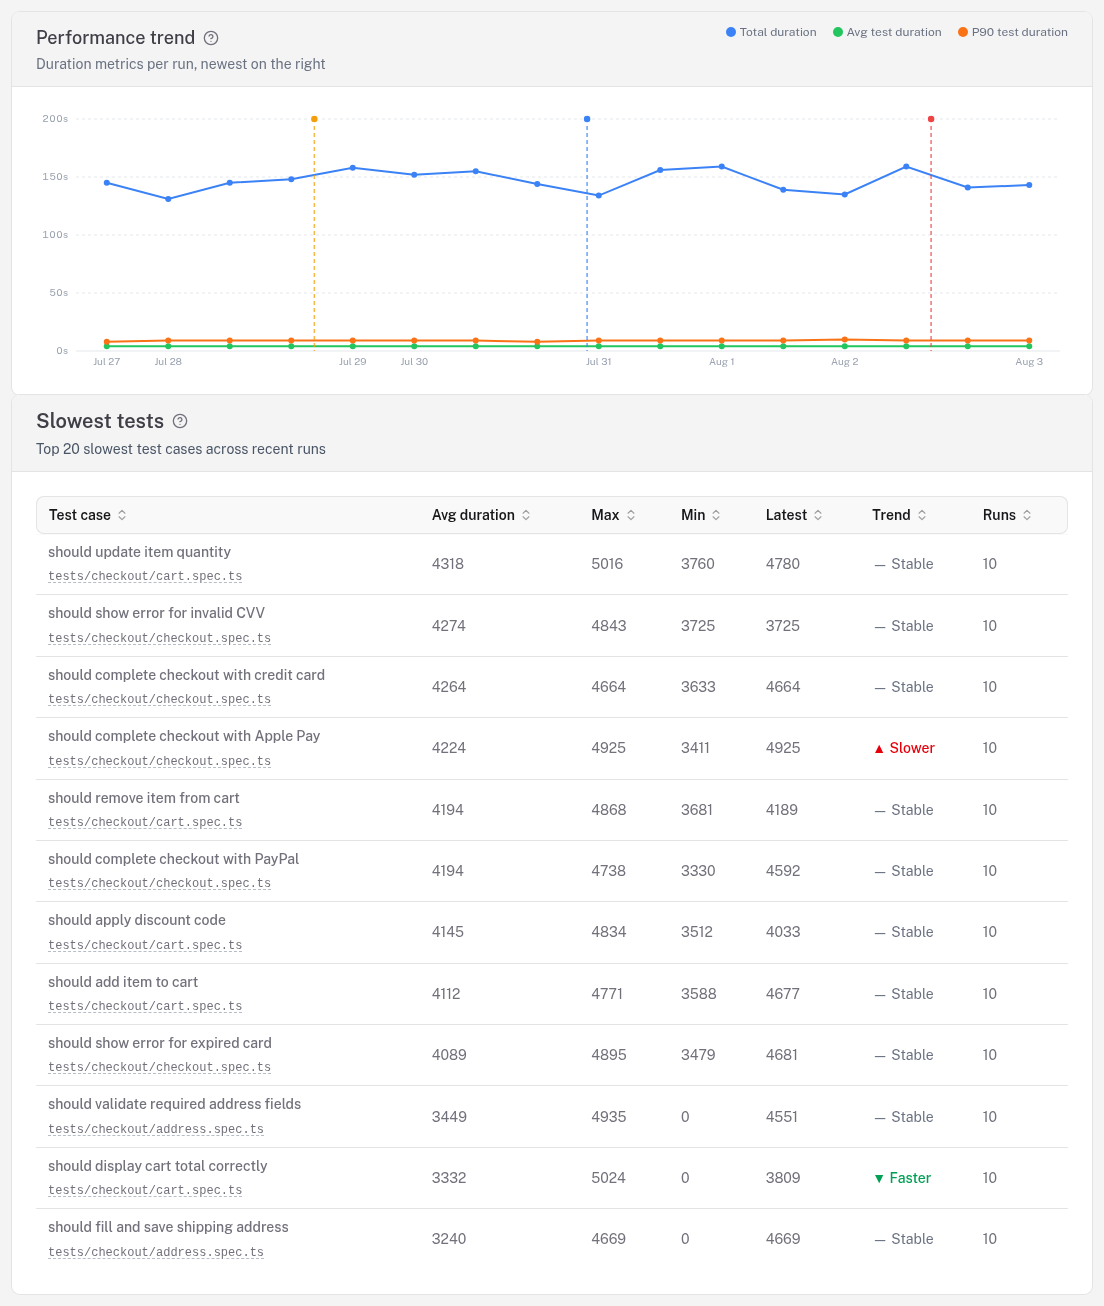
Read the P90 line, not the average: a handful of slow outliers move P90 and barely move the mean, and it's the outliers that decide how long a shard takes.
4. Stop paying for flaky retries
A flaky test bills you twice — once for the failed attempt, once for the retry — on every run where it misbehaves. That is why Piwi ranks flaky tests by wasted CI minutes rather than by flakiness score: a test that flakes constantly but finishes in 200ms costs nothing, and one that flakes weekly on a four-minute timeout is what actually hurts.
Cutting the flakiness that costs the most is the whole recipe for this. The short version: sort by impact, fix the red dots, and quarantine the rest so they stop blocking merges while still running.
5. Ask whether the app is slow, not the test
Everything above shaves time off the harness. This step is the one that finds a real performance bug.
- Slow endpoints — on a run, network requests grouped by method and normalized route (
/api/users/:id) with avg/p90/max duration and error rate. Analytics lifts the same view across every project, so a shared endpoint regressing shows up before any single suite notices. - Web Vitals — TTFB, FCP, LCP, CLS and the rest per execution, color-coded. LCP/CLS/INP are Chromium-only, and INP needs an interaction, so short tests often show
n/a.
Both require the capture fixtures — the reporter alone cannot see the network. Without them you still have the trace: its network waterfall shows the same requests for one execution, just not aggregated across the suite.
6. Spend the parallelism you already have
- Worker imbalance is called out in a run's Insights: if one worker finishes long after the others, the suite is as slow as its unluckiest shard, and no amount of per-test tuning fixes that.
- Sharding is Playwright's own
--shard; Piwi merges the shards back into one run, so you can raise the shard count without turning your history into fragments. See CI & sharding.
Other ways in
Ask your agent. Over the MCP server — no install, it is part of the server — get_slow_tests returns the ranked slowest tests, get_performance_trend the duration history, and get_run_insights the worker-imbalance and duration deltas for one run. Useful for "what should I speed up this sprint?" without opening a browser.
Script it. The same numbers are on the REST API if you would rather post a weekly CI-cost figure into a channel — see the API docs.
Watch it drift. Rather than auditing periodically, subscribe to the perf.regressionnotification event and let it tell you when a duration trend breaks.
See also
- Flaky tests → Performance — the full reference for trends, slowest tests and timeout hygiene
- Cut the flakiness that costs the most — step 4 in full
- Analytics — CI time and wasted CI time across every project
- Capture fixtures — what unlocks the network and Web Vitals views