Forty tests are red — where do I start?
Almost never with forty bugs. A run that goes broadly red is usually two or three causes wearing forty costumes: an environment that didn't come up, an auth change, one shared component, one bad worker. The job is to collapse the list before reading any stack traces.
1. Read the clusters, not the tests
Failures sharing an error fingerprint are grouped automatically, so the run tells you "40 failures, 3 root causes" before you open anything.

Fingerprinting masks the volatile parts of an error (timeouts and other numbers, UUIDs, URLs, the expected and received values of an assertion) so the same underlying failure groups across tests, spec files, and runs. It's always on and needs no configuration.
2. Rule out the boring causes first
Before treating any cluster as a product bug, check the two heuristics on the run's failure groups:
- Worker correlation — if a cluster's failures are concentrated on one worker, you're looking at a misbehaving worker, not forty broken tests.
- Flaky share — a cluster made up largely of known-flaky tests is noise riding on a bad run.
An environment that never came up has a signature of its own: everything fails, fast, on a navigation or connection error. That's one cluster, one fix, and no test code involved.
3. Triage each cluster once
A cluster page puts the whole investigation on one screen: the signature and resolution at the top, a Triage rail on the right that sets one status — open, resolved, or ignored — plus a note for the entire group, and collapsible evidence sections down the left. Forty tests, three decisions.
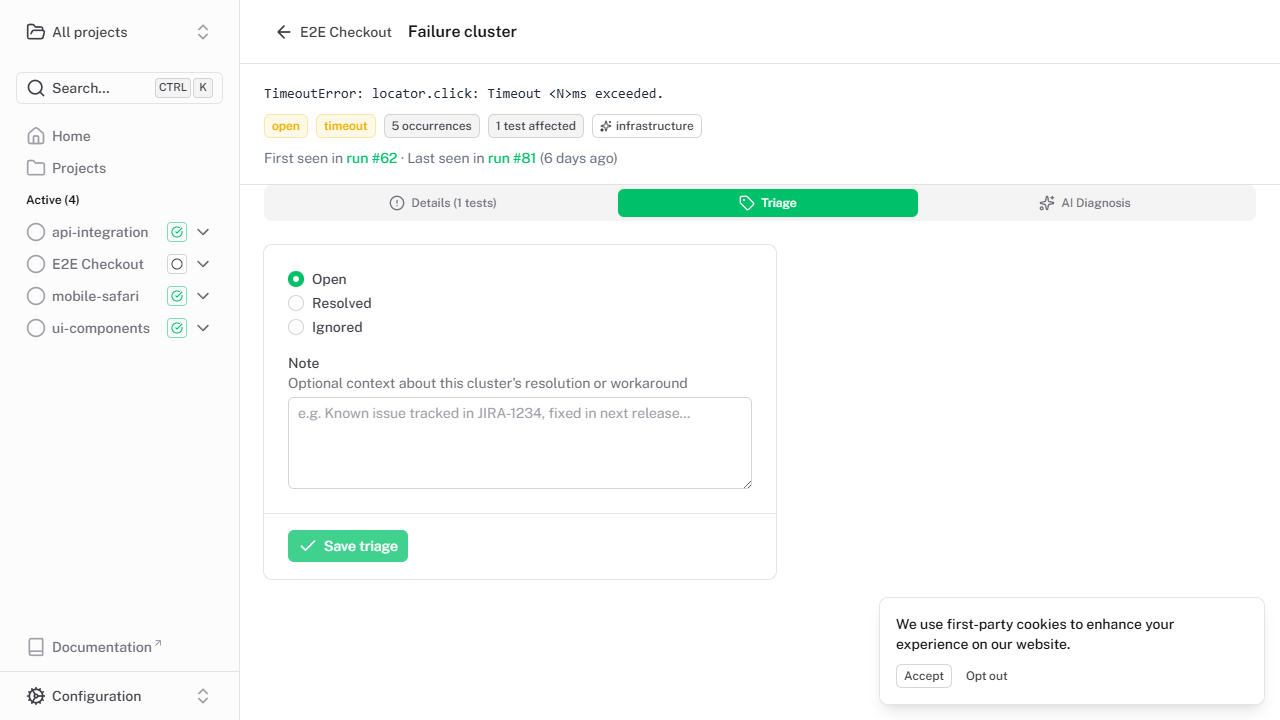
Clusters stay open across runs, so the next red build attaches to the same row rather than starting the conversation over.
4. Confirm the fix actually landed
When a later run executes every test a cluster covers and they all pass, Piwi records the fix — the run, the commit, and how long the cluster was open — with three separate verdicts, because they aren't the same claim:
| Verdict | Means |
|---|---|
| Stopped failing | The tests pass again. A flaky test can manage this by accident. |
| Diagnosis verified | Commits since the last failing run touched a file the suggested patch named. |
| Regressed | A fix was recorded and the cluster is failing again. |
Optional: let a model do the first pass
With AI diagnosis configured, each cluster gets an explanation read against your actual git diff since the last green run, and any suggested patch is validated against your source before it's shown. It's off by default and works with a local model — the point is that clustering has already decided what is worth diagnosing, so the model runs a few times per run, not forty.
Configuring an embedding role additionally merges clusters that are the same root cause phrased differently. Without one, clustering stays purely deterministic — still useful, just less aggressive about collapsing near-duplicates.
Other ways in
From your agent. get_failure_groups over the MCP server returns a run's failures grouped by cluster with the worker correlation included, and get_test_case_context pulls the evidence behind a single failure — steps, console, network, SCM diff. No install; the server is part of the dashboard.
From a script. The same grouping is available over the REST API if you'd rather post a summary into your own channel — see the API docs.
Before anyone opens anything. Subscribe to the cluster.new notification event instead of run.failed: you hear once when a genuinely new root cause appears, not on every red build, and the payload carries a sample error excerpt and the affected cases.
See also
- AI diagnosis & failure clustering — how fingerprints and semantic merging work
- Regression or flake? — when it's one test rather than forty
- Core concepts — cluster, fingerprint, baseline